Video CDN Statistics
The following data is available to you for your resources:
- Generalized Stats Overview
- Traffic, Speed, Cache and Storage utilization
- Displayed Period Selection
- Specific Resource Statistics
To view your Video CDN statistics, go to the Websa user panel Dashboard section.

¶ Generalized Overview
The upper row of the Dashboard section displays an account summary on the number of Video CDN resources, effective tariff and resource consumption for the current month.

¶ Traffic, Speed, Cache and Storage
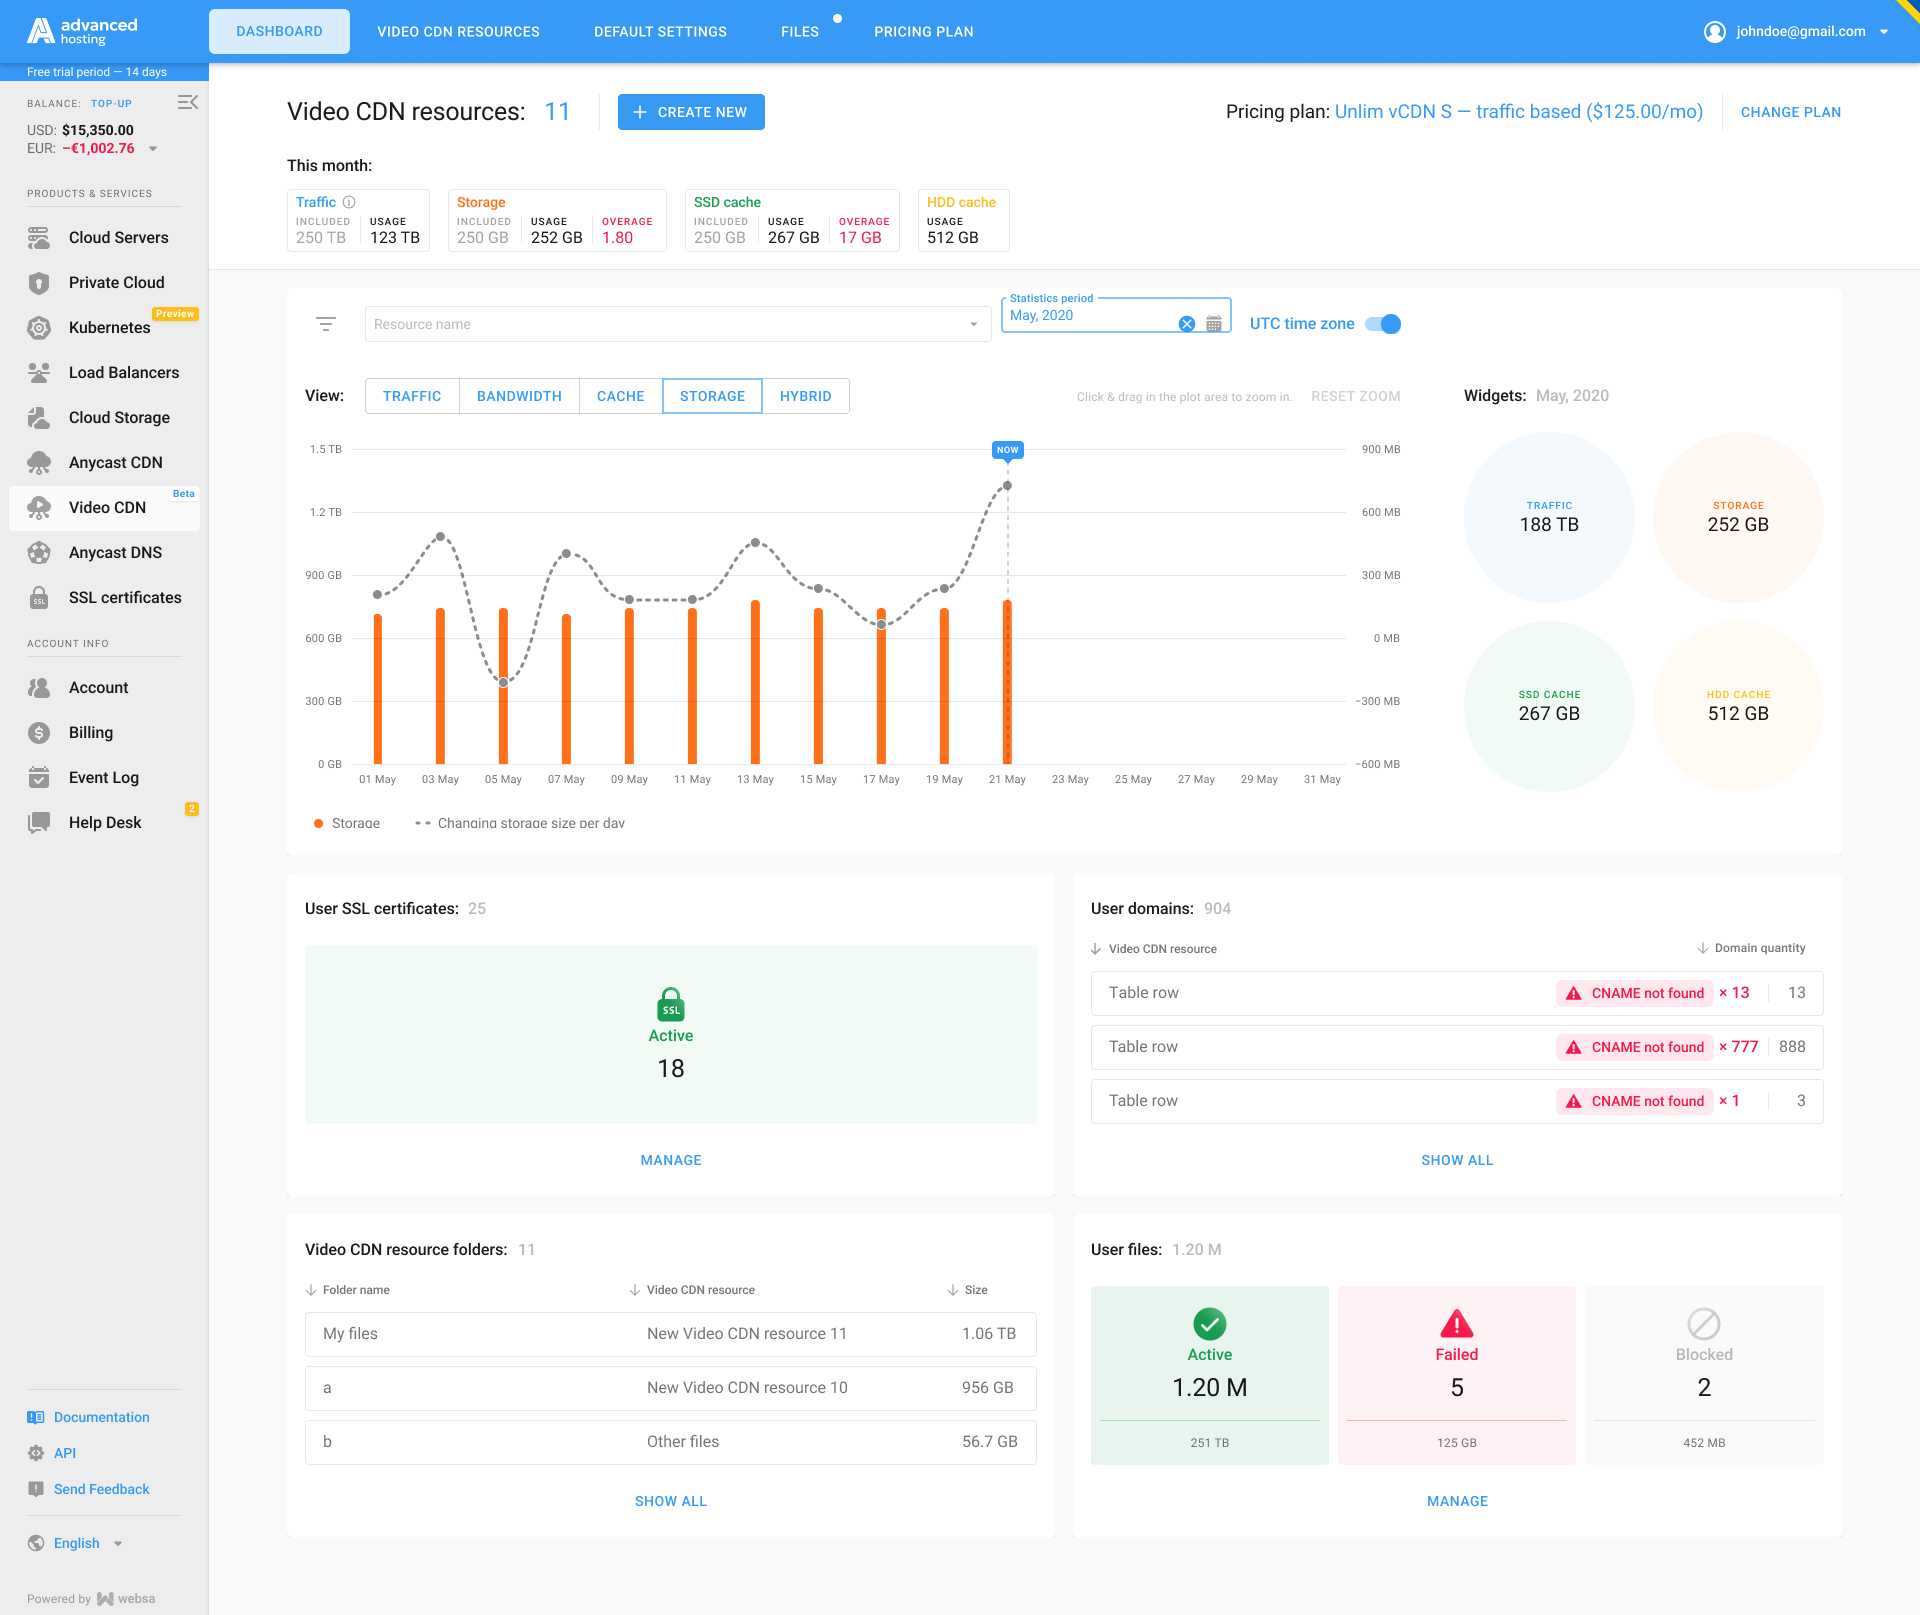
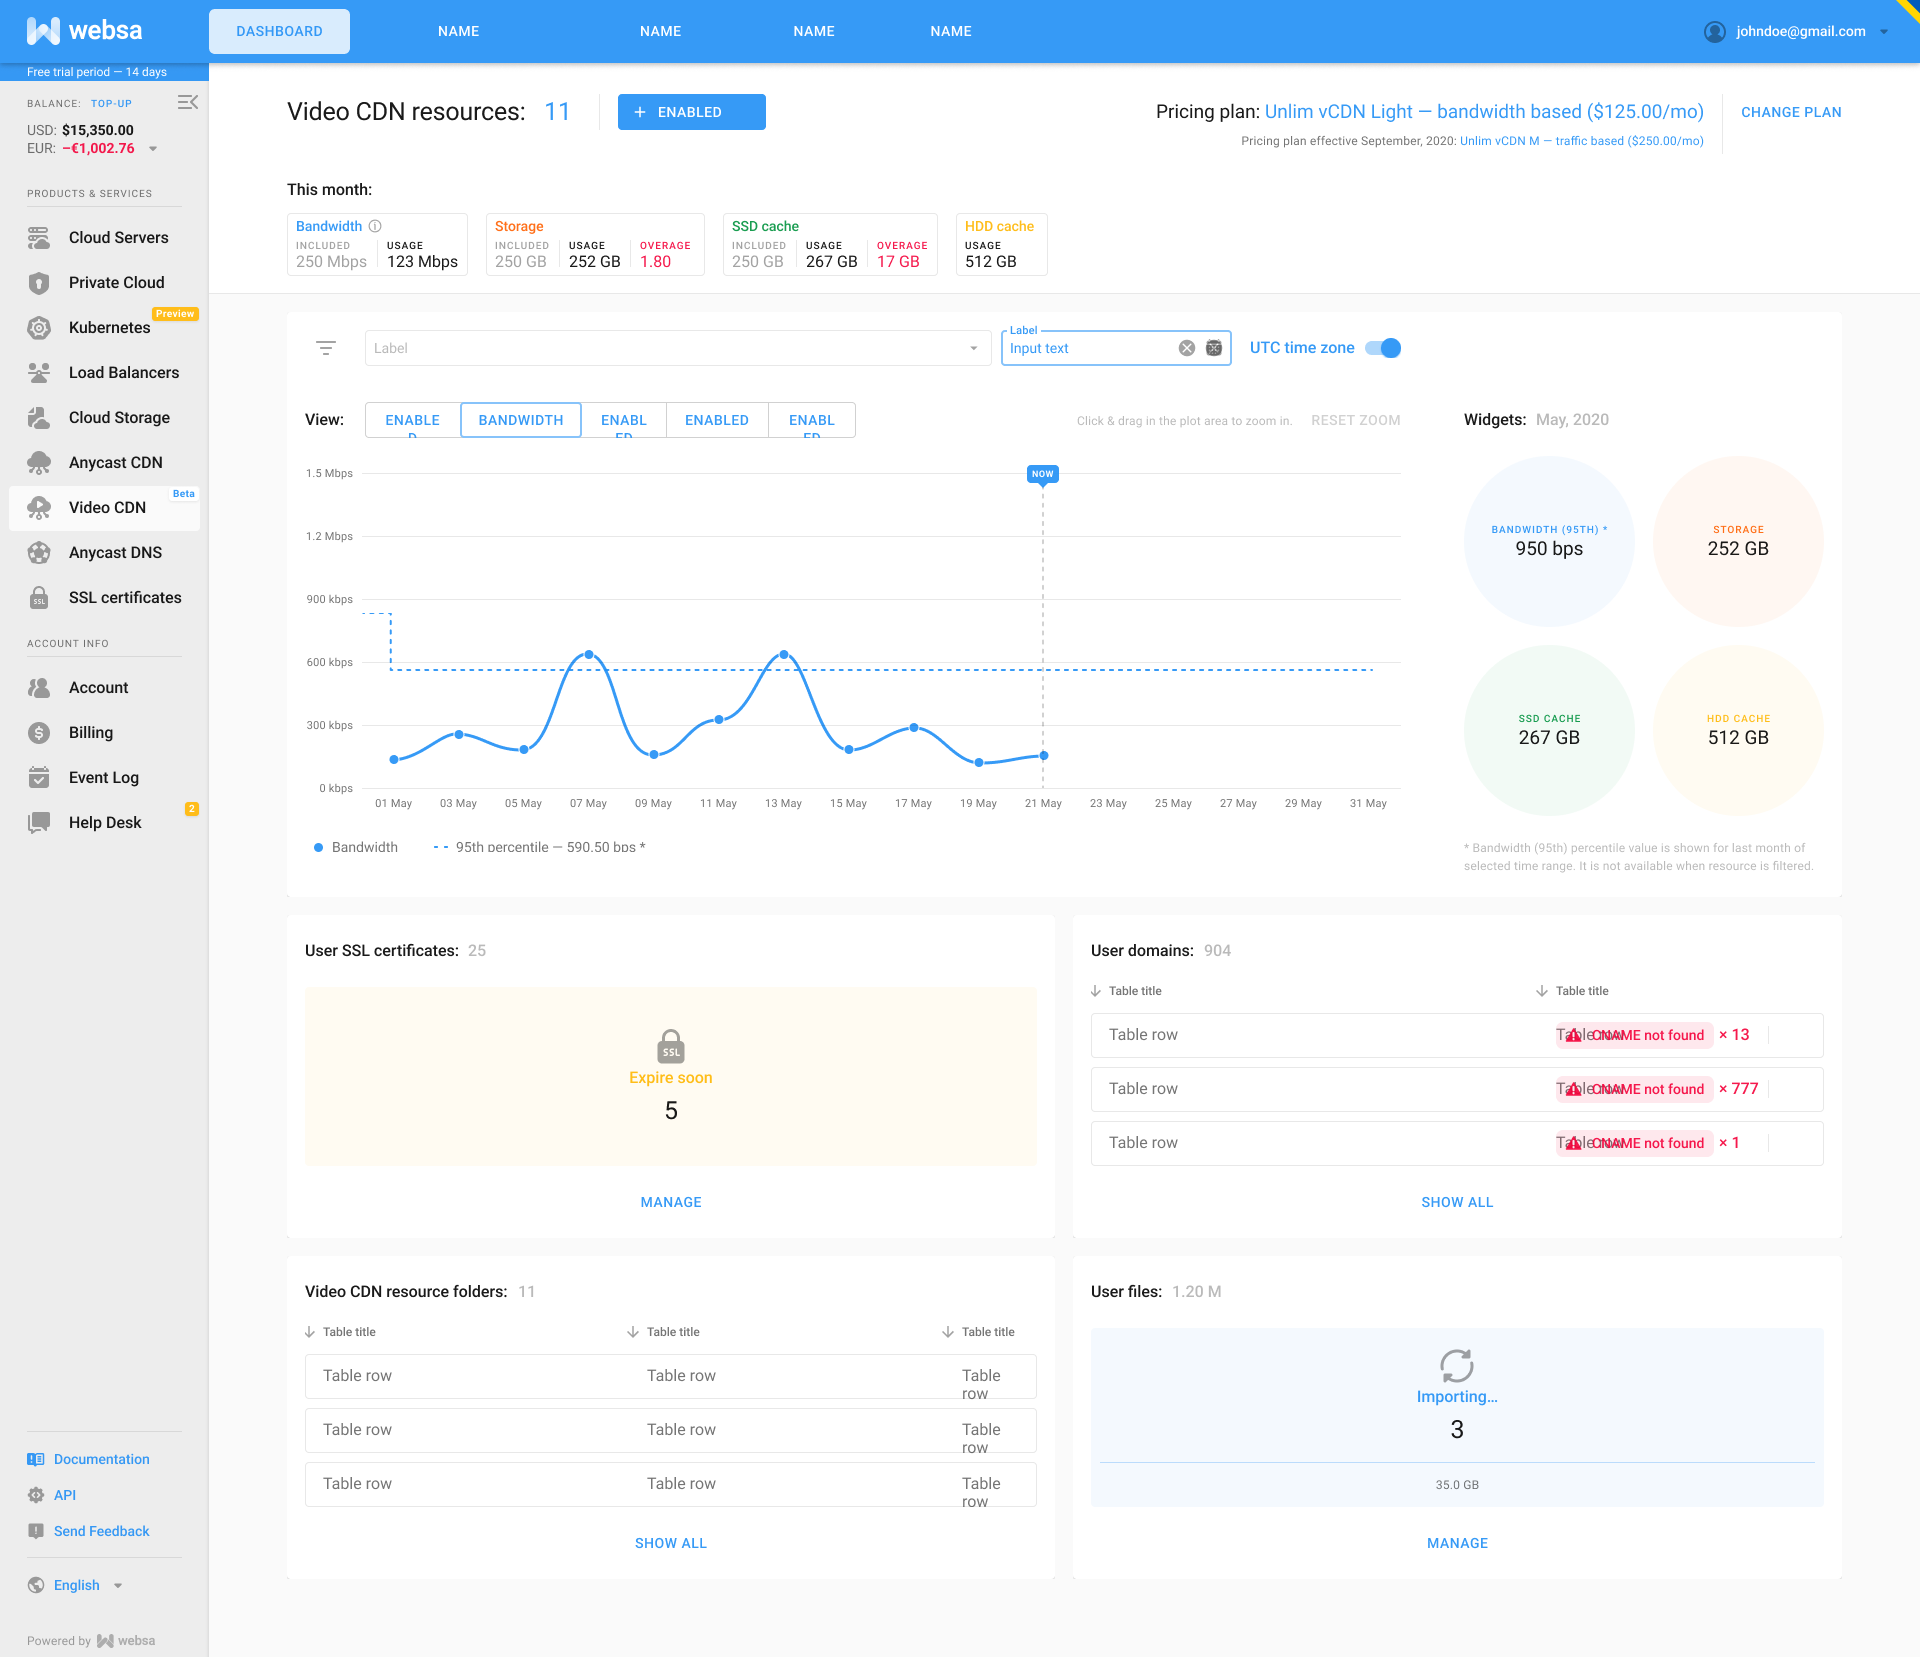
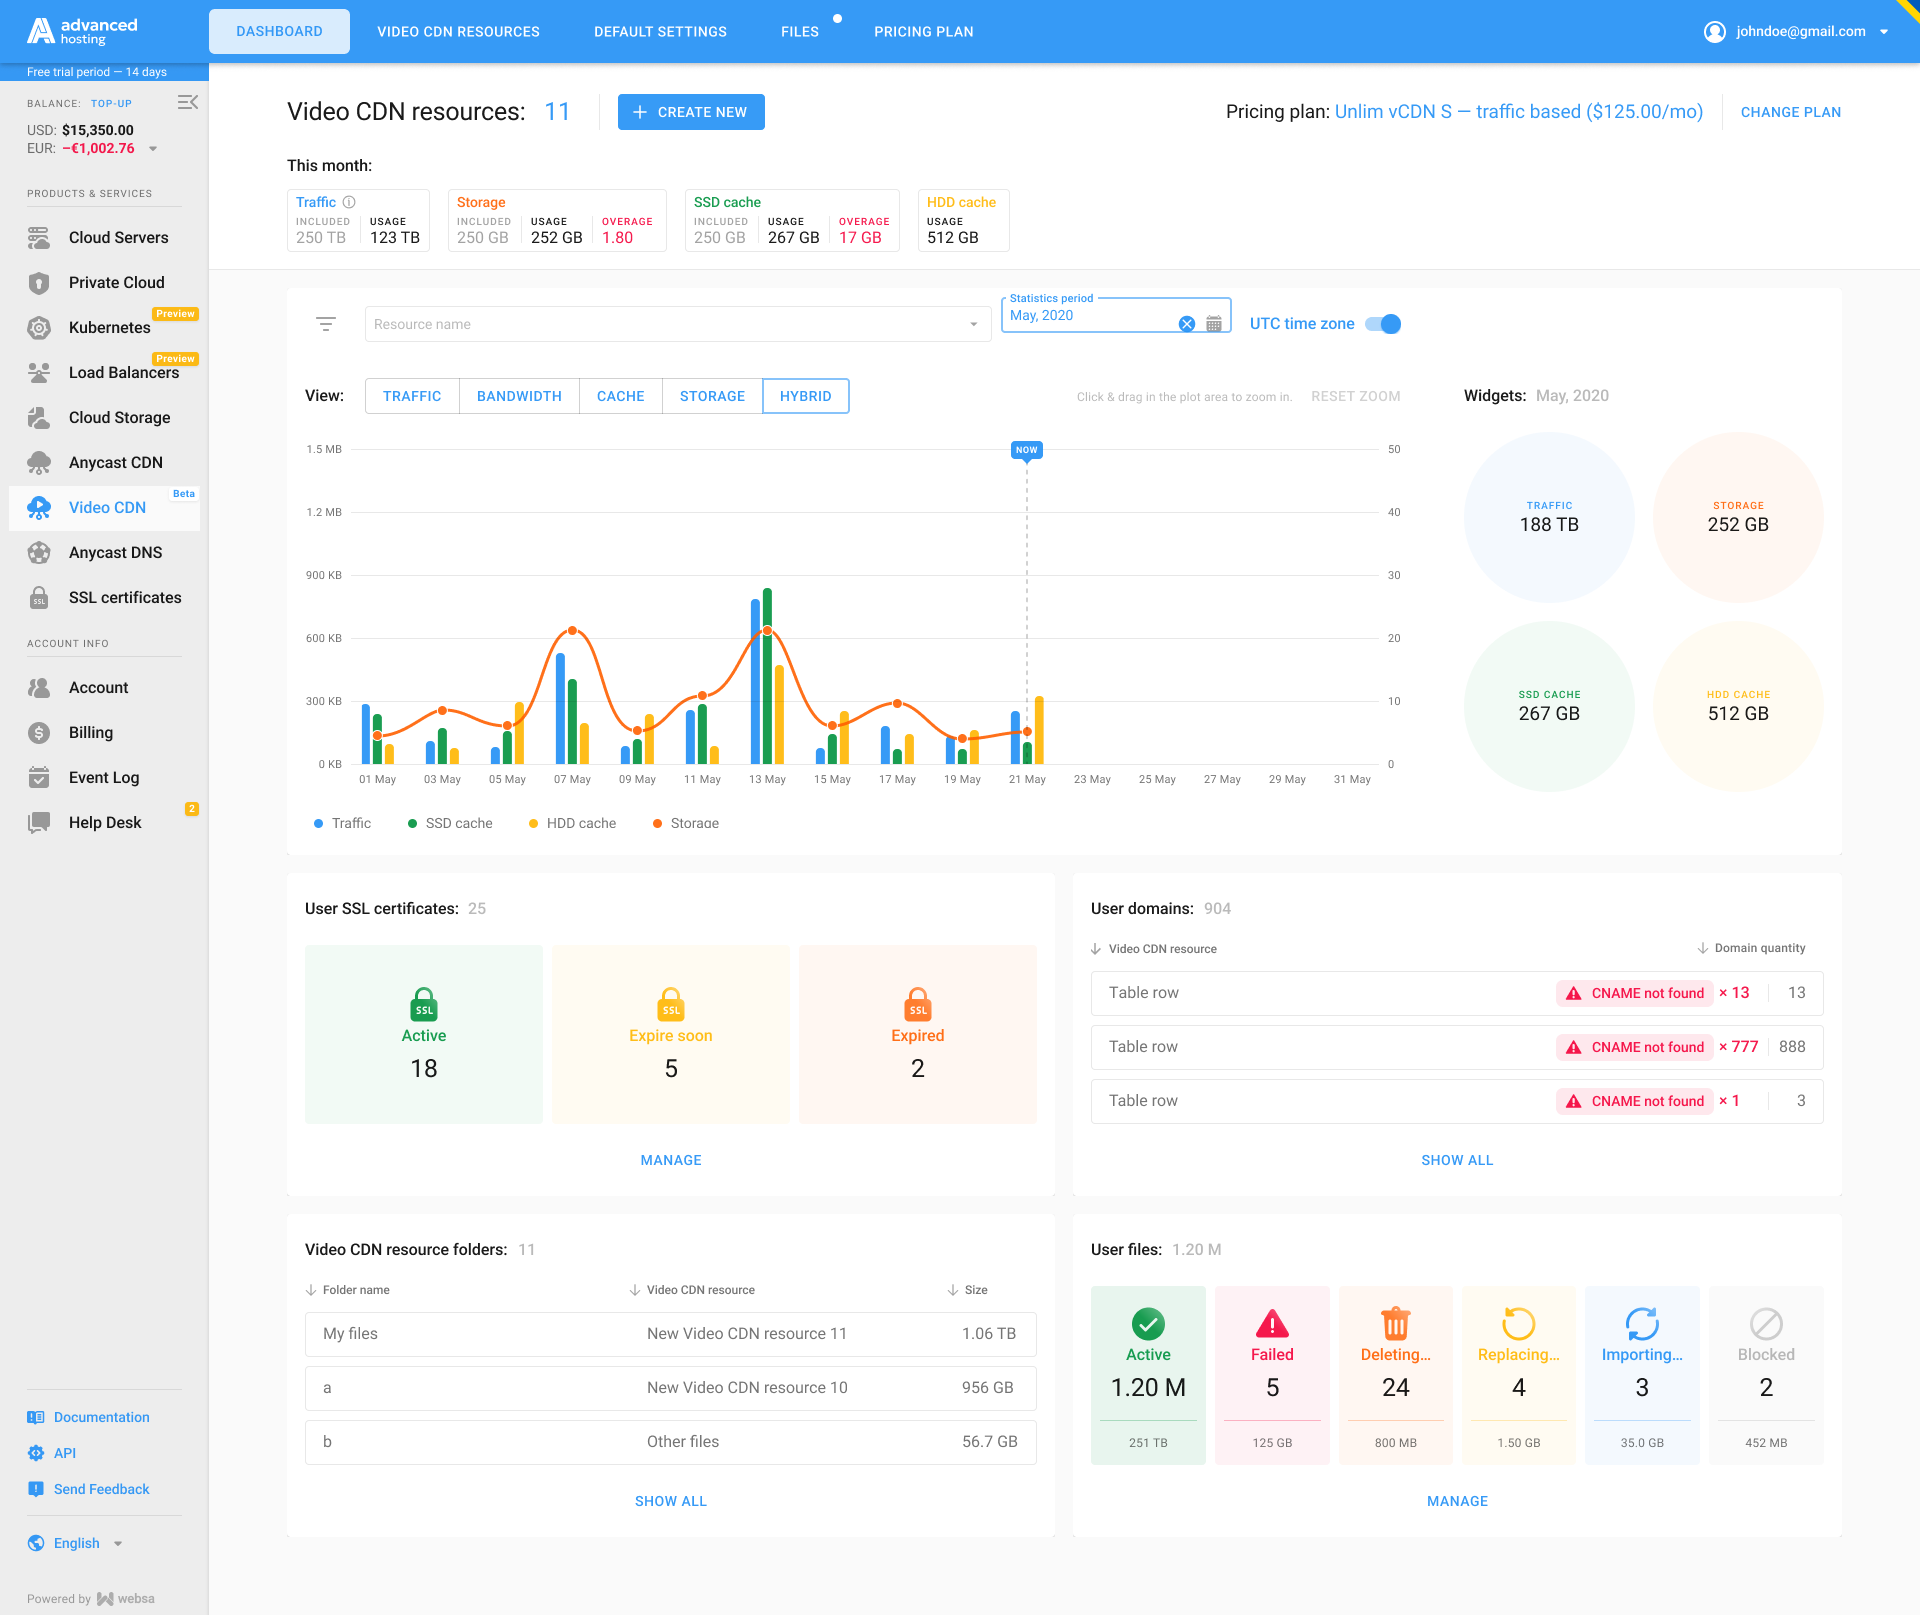
To view stats on traffic usage, speed, cache, and stored data volume, click the corresponding buttons on the filter panel, as shown below.

This filter allows you to control the dataset displaying in the graph below. The control panel combines and depicts the dynamics of Video CDN key indicators:
- Traffic — the amount of traffic transmitted through your CDN over a period of time.
- Cache — the volume of your resource files stored in the CDN cache.
The data on the chart will become available only upon adding of at least one CDN resource, according to its actual use.
- Storage — the volume of your files uploaded by you and auto-imported to the CDN, stored on the storage servers.

- Bandwidth — defines the upper threshold of the effective content distribution speed (in Mbps).

- Hybrid — all of the above parameters on one graph.

¶ Period Selection for Stats
To view statistics for a certain period, specify it in the filter as shown below:

By default, statistics are displayed for the current month. After applying the filter, the data is immediately updated.
¶ Specific Resource Statistics
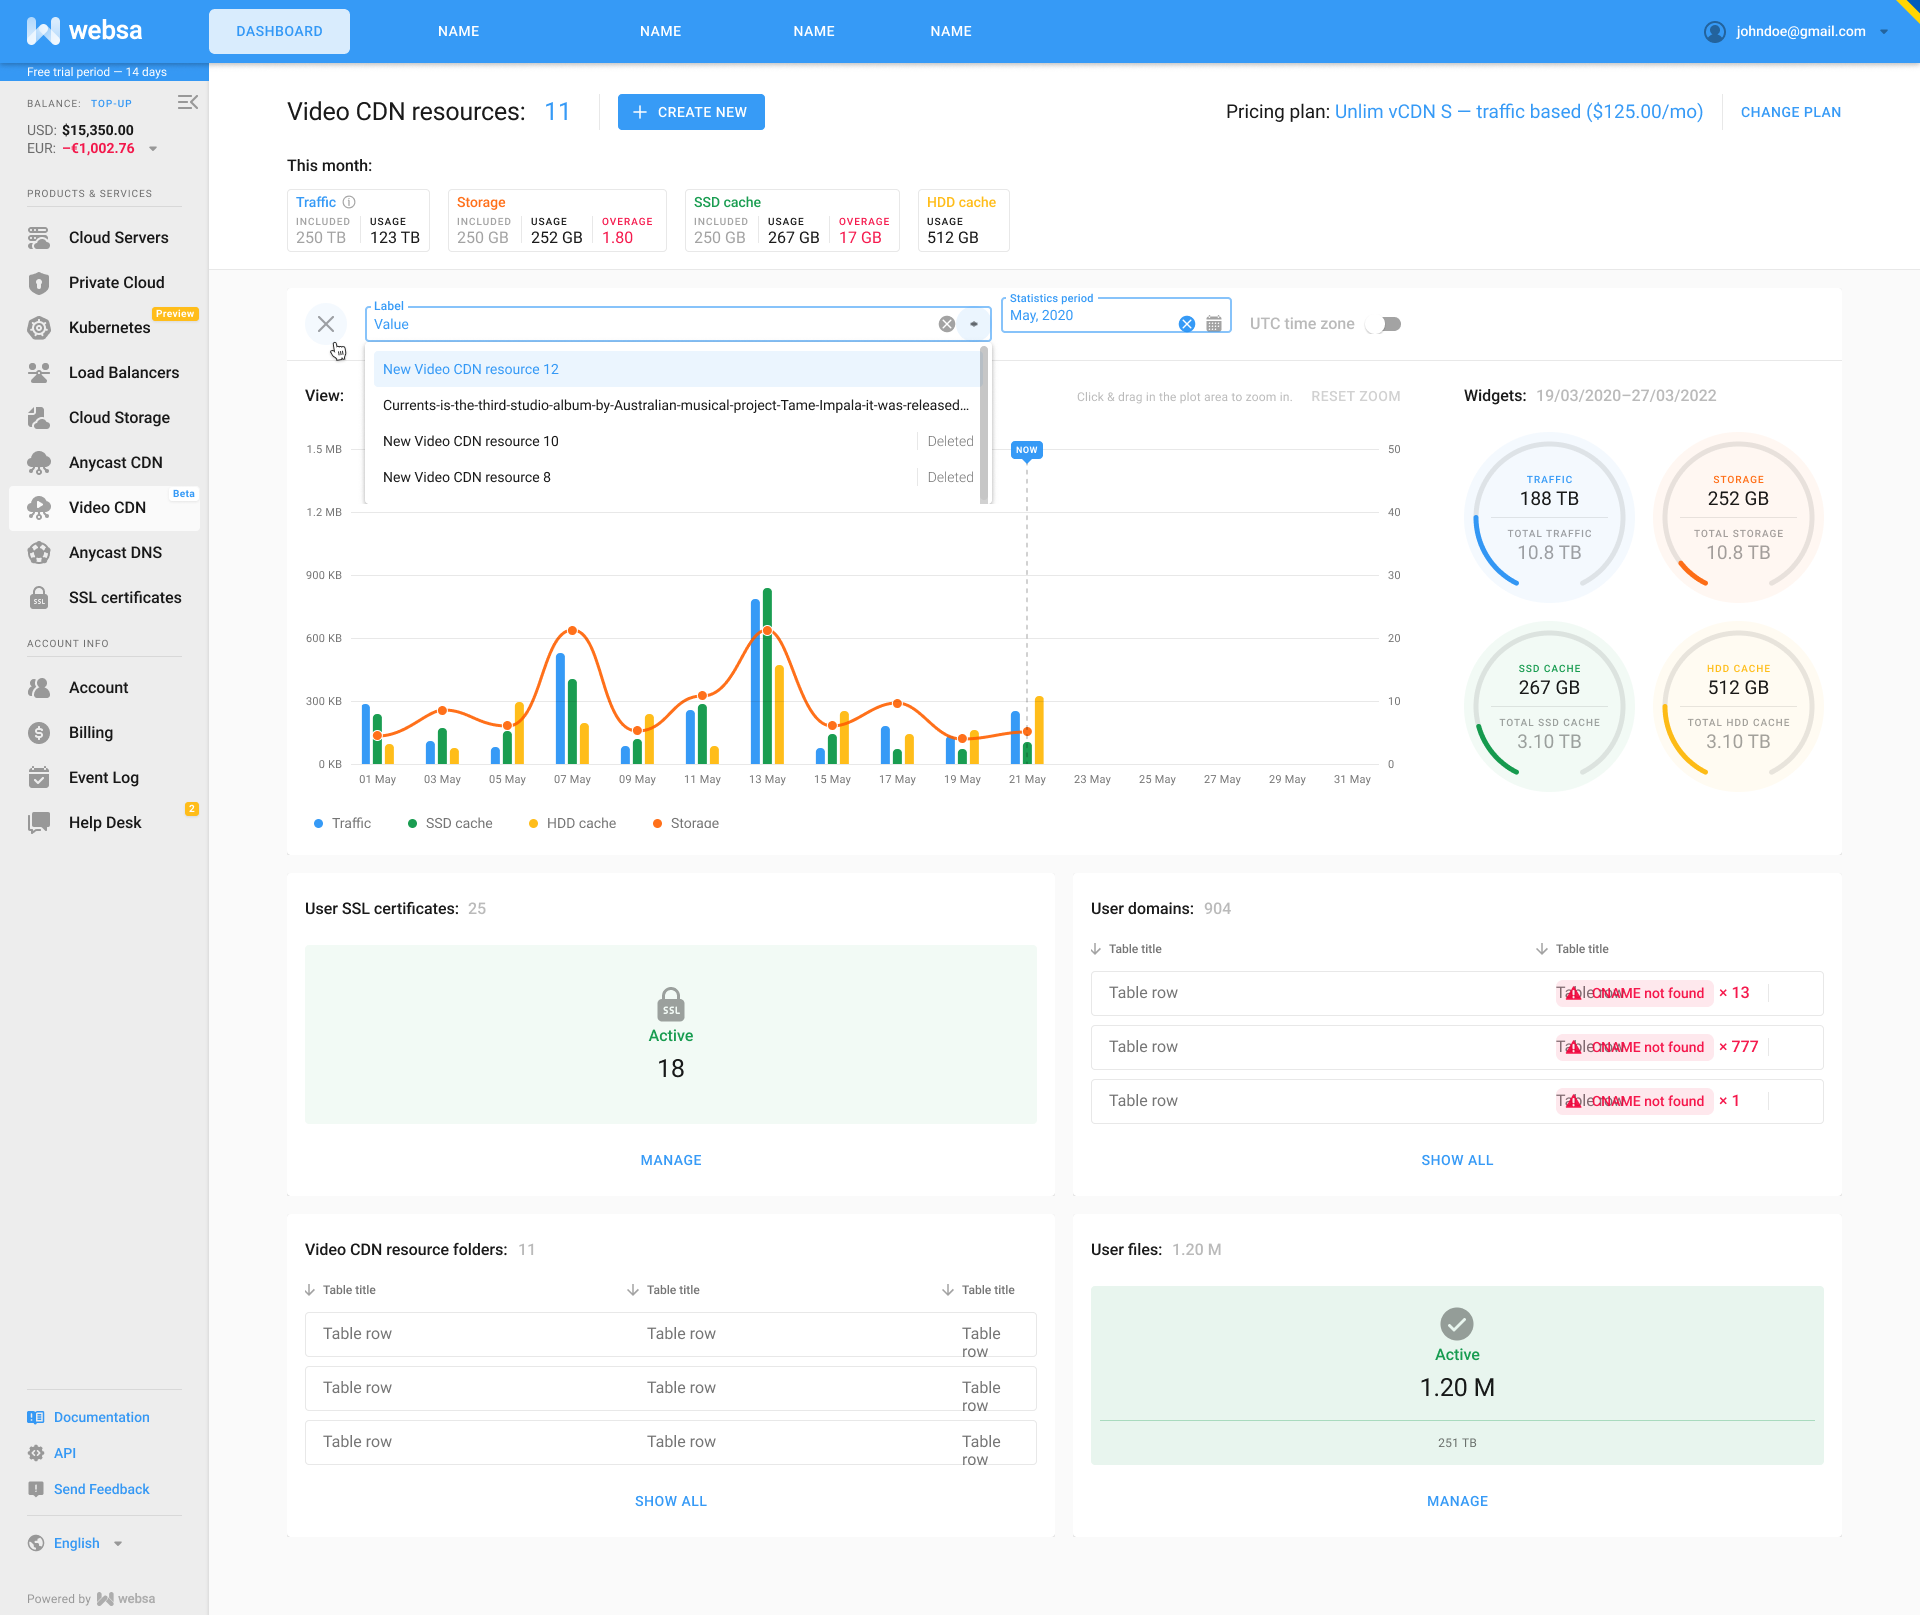
To view statistics for a specific CDN resource, select it from the drop-down list in the filter, as depicted below:

Cumulative data for all of your resources is displayed by default (without filters applied).
To reset the filter to the default values, click the icon shown below:

After the filter reset, the current month’s speed or traffic data will be displayed (depending on the type of your tariff).
The Dashboard also allows to:
- Add a new CDN resource by pressing Create new button (see Add your first CDN resource if you don’t have any so far)
- Change your current pricing plan, as shown below:
